
Visualisations and the Digital Memory Database
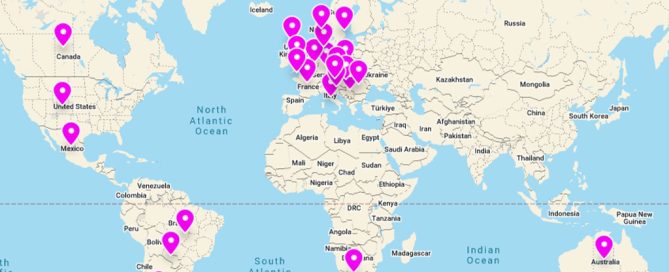
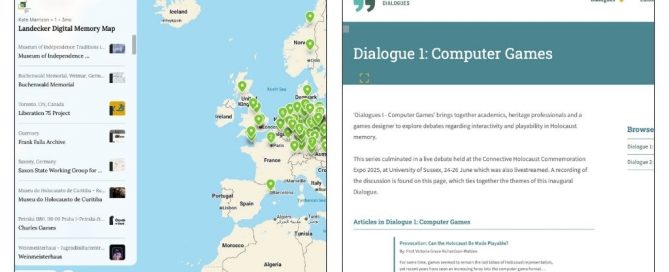
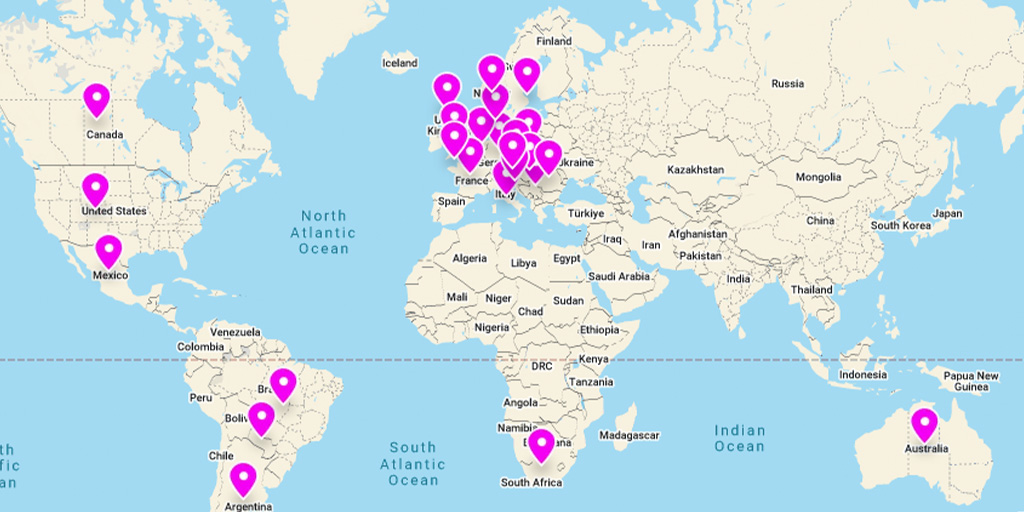
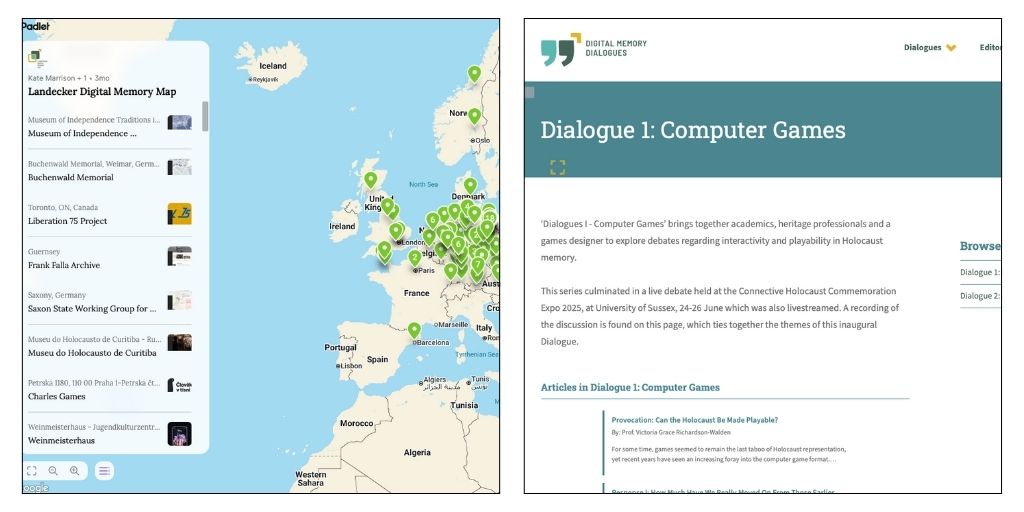
By Dr. Ben Pelling In this week’s blog, Research Fellow Dr, Ben Pelling introduces the data visualisations embedded into the Digital Memory Database – our flagship platform, launching later this month. In building the Digital Memory Database, to be publicly launched on International Day of Commemoration in Memory of the Victims of the Holocaust, we have included a number of interactive visualisations that use a live feed of the data contained within the database and so adjust and update as new content is added. These visualisations have two purposes – they offer alternative ways to explore the projects, interviews and walkthroughs but also form the foundation for quantitative analysis of the data and metadata captured in the database as a whole. Each has been deliberately designed to provide filtering and sorting options, so that each user can focus on the information they seek. World View (Globe/Map) Central to the homepage is a map, viewable in either globe or ‘flat’ map form, that locates all the organisations that have been included in the database. Although the database can be interrogated via the search function and browsed via the archive index, the map provides a visual way to explore the content. [...]

